“Regression Discontinuity” Explained Though a Half Marathon
A couple of weeks ago I ran the Robin Hood Half Marathon in Nottingham. 15,000 people all running through the streets of Nottingham, music, dancing, cheering, raising money… It was brilliant.
Of course, with 15,000 runners, you can’t just set off all at once. Anyone who has done a busy parkrun with a few hundred people will tell you it can be a bit chaotic, so with thousands, it needs managing.
In a busy race like this, you set off in ‘waves’. As I was waiting for my race to start, 10 minutes after the starting gun had already fired, my research and evaluation brain was also firing off, and I wondered:
“Would being in a faster ‘wave’ also make me faster?”
I wonder how we’d measure that.
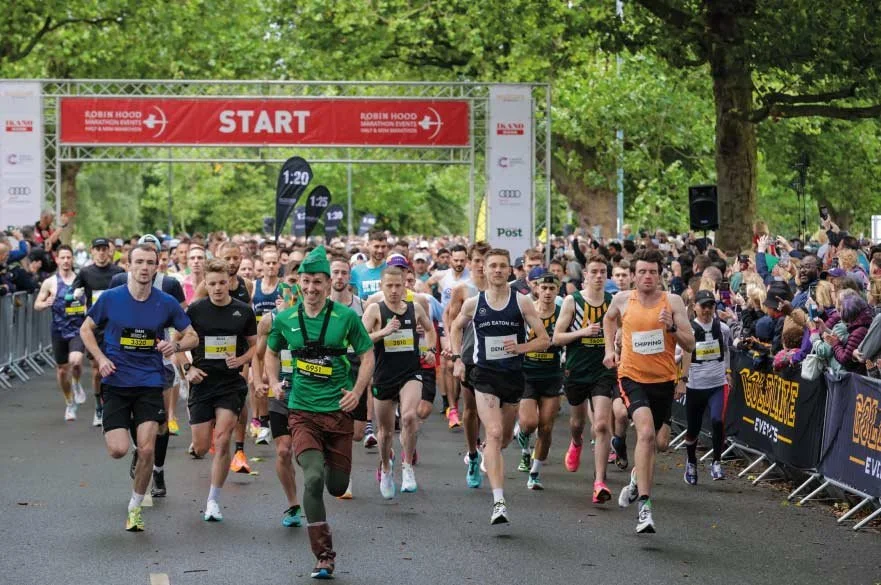
Image from Nottingham Trent University website (here)
Choosing your wave
When you run something like this, you have a ‘gun’ time (the clock starts the moment overall race starts, and ends when you cross the finish line), and a ‘chip’ time (the clock starts the moment you cross the start line, and ends when you cross the finish line).
For almost everyone in the race, it’s the ‘chip’ time that is the one you care about. That’s what I’m looking at going forward.
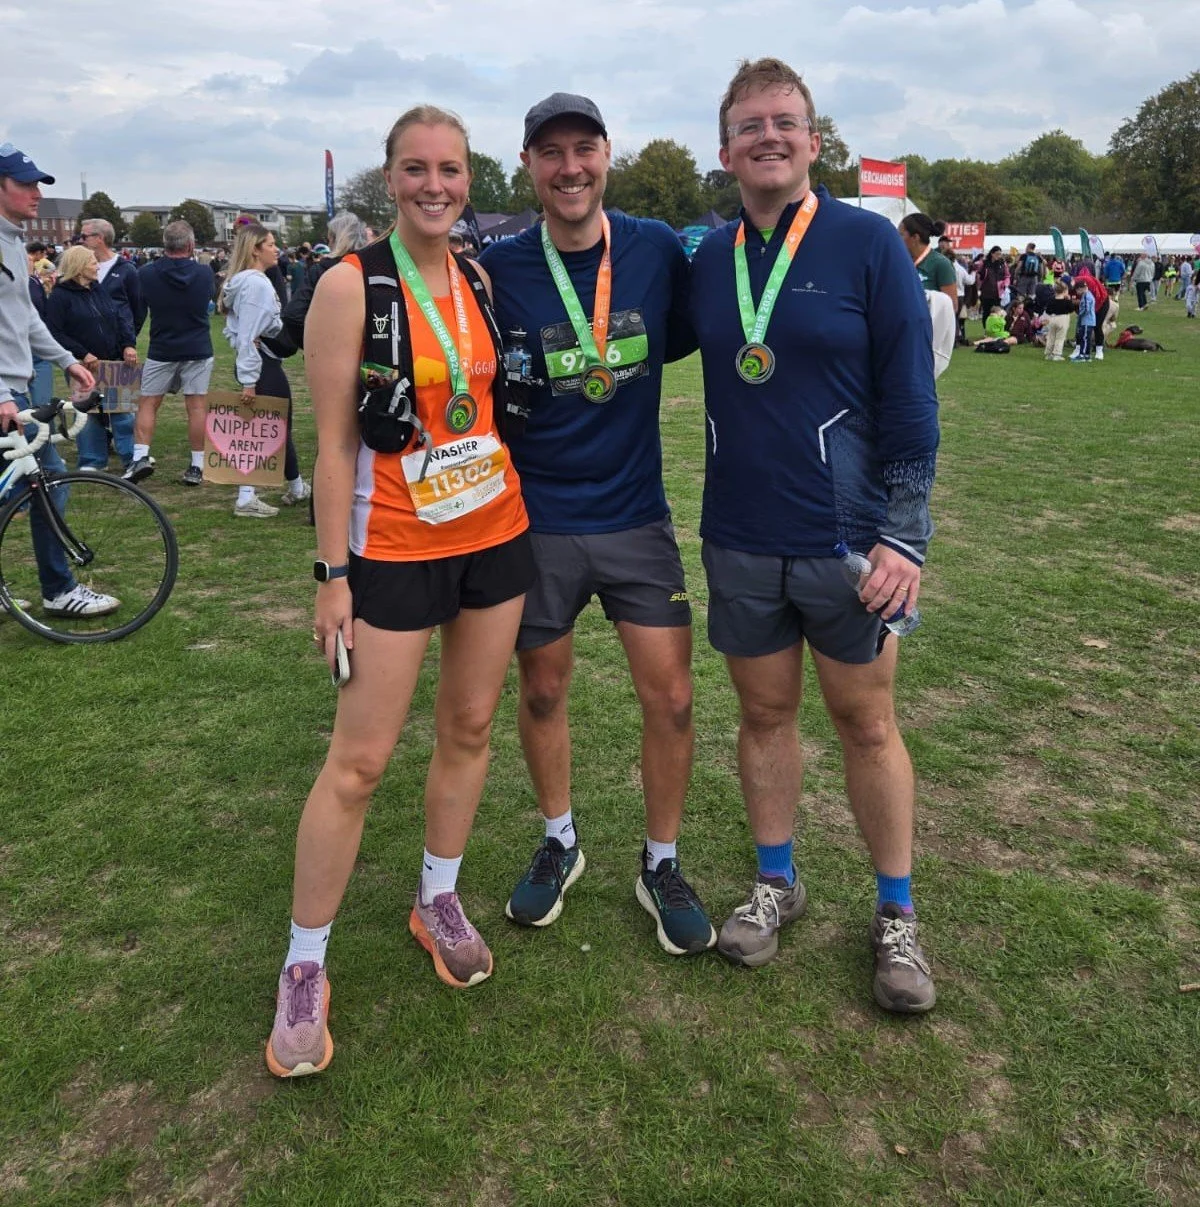
See, look how delighted we look!
When you enter the race, you give your estimated finish time to the nearest minute. Then that weekend, you get a coloured bib based on that time, which puts you into a wave. For the Robin Hood Half these were:
White = elite
Yellow = sub 1:40:00
Red = sub 1:55:00
Blue = sub 2:05:00
Green = sub 2:30:00
Orange = everyone else
Runners then group at the start into waves, and marshals make sure you don’t jump ahead.
I estimated my finish time as being around 2:10:00 before the race, so I was green. Running with people who were aiming between 2:05:00 and 2:29:00.
As the race started, I felt carried along with my wave. I got into a rhythm and generally I matched my pace with the people around me. I got familiar with these same runners, and although I didn’t say a word to them as I ran, they were my companions for the next two hours.
We all crossed the line together, and I finished 2:06:29, a time I personally was delighted with.
But if I’d started one wave up, with the blue runners, would I have run it faster?
Would running with those who were more likely to have had that sub-2hr in mind, have carried me through at a different pace? How would you evaluate the impact of the wave?
Why you can't just compare blue and green
The obvious move is to compare finish times for runners in the blue wave and runners in the green wave. Blue runners finish faster.
Well… yeah… the blue runners are faster. They had quicker estimated finish times.
This is a key problem in evaluation. When two groups differ, you can’t tell what caused a difference, or whether the groups were simply different to begin with.
But with a cut off like we had in the waves, there is a trick. Look at the line.
The line, and discontinuity
Here’s the idea. There was a cut off around 2:05:00 where the wave you’re assigned to, changed.
Think about two runners, who estimated their time to the nearest minute. One said 2:04:00. One said 2:06:00. These two are practically, almost identical runners. Practically the same fitness, same ambition, same level of preparedness. But one starts with the blue wave, and the other starts in the green wave.
If you gather lots of runners, and plot their estimated time, against their actual finish time, you’d expect a smooth upward line. Slower estimate, slower finish. Faster estimate, faster finish. But, if the wave itself makes a difference, you’d see a little jump where that line cuts off.
Here’s what it looks like with some made up data…
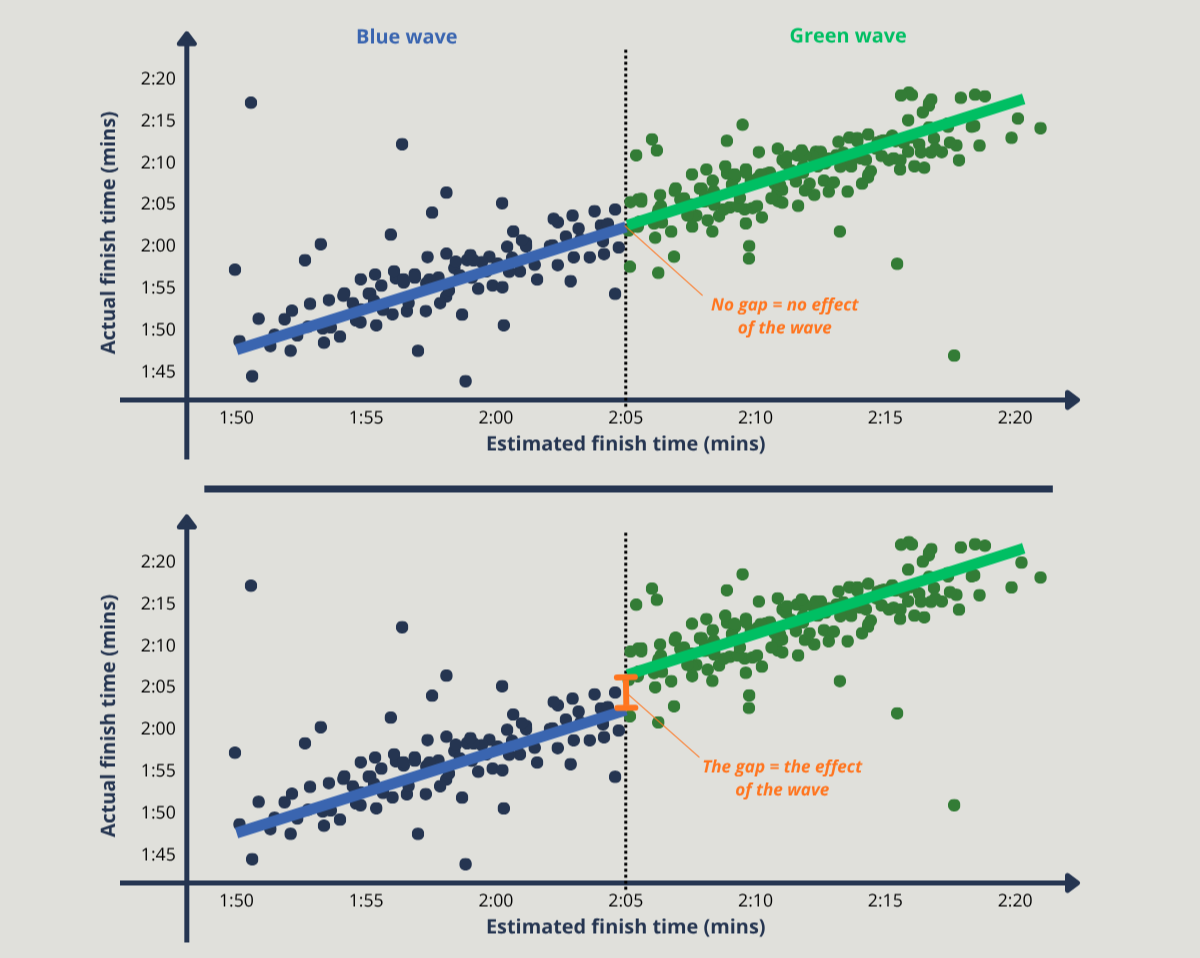
The little jump is the impact of the wave. And this is called a Regression Discontinuity Design. The ‘regression’ is relationship between our two variables (the line mapped through the data), and the ‘discontinuity’ bit is the difference between the two groups (the break at the cut off).
The graph here demonstrates what it might look like if my hypothesis is true. Of course, the jump might actually go the other way. If I was in the blue wave, I may have actually gone off too hard, and then blown up 5k before the end, and ended up much slower. But either way, the jump would give that evidence.
This method in practice
This is a fantastic method, that we could use more of in evaluation. But! It would only work in practice with a few caveats.
These are some things to consider…
People give accurate estimates. This rests on the runners either side of the line being alike. If people are choosing their estimate strategically, for example being slightly more ‘ambitious’ to get into a faster wave, then it skews the data. Also, people like round numbers, and I’d expect lots of people may have just given a round 2:00:00 as an estimate. So if we had everyone’s estimates, we might want to see how many runners declared by the minute. A smooth spread is what we’d want, but I’d bet with this example, we might not see it.
The line needs to be sharp. We need a distinct gap between groups. The waves at the Robin Hood Half set off with a gap between them, however you were also allowed to group with your mates in the same wave or even drop to a slower wave if you wanted. So, this makes things a little fuzzy.
The results only apply near the line. The cut off between blue and green waves was at 2:05:00, and it will tell you about the runners either side of it. My self-prediction was 2:10:00, so I probably wouldn’t be included in this sample.
If I were to actually do this for this example, there are also two additional main hurdles to overcome:
The data problem. While finish times are public knowledge, and you could probably find the wave colours from the millions of photos of all the runners taken, you wouldn’t have their estimated finish time. So I can’t actually demonstrate this, only the organisers can.
The power problem. Even if I had this data, there may not be enough runners close enough to the cut off, to measure an effect. 15,000 runners sounds like a lot, however only a small number sit next to the 2:05:00 cut off between the blue and green waves. So for this methodology, you need a LOT of data points on that boundary.
Statistical ‘Power’ is something that can be missed, but it’s important. The fewer data points you have, the bigger an effect must be to be measured.
An individual’s overall time may vary by minutes, because of things like the weather, breakfast, or how good a sleep you had the night before [I have a one-year-old, so this for me varies WILDLY]. The impact of the ‘wave’ may have only been seconds or tens of seconds. We need more data points to get rid of the noise.
For this experiment, we likely need thousands of runners to be near the boundary, so we can be sure we’re detecting something real. A power calculation is fundamental in this.
Luckily! You don’t need to start doing too much maths. There are free online tools that can do this for you (like here, or here, or here). This is worth thinking about.
Where this works better
Okay, so this has been about half marathon times because I’ve done one recently. But there are better real-world use cases.
What about this…: student bursaries.
There are university bursaries across the country available to students, based on household income. There will be many students who were just under the threshold, and many who were just over the threshold.
It’s a hard boundary (you either get the bursary, or you don’t), based on household income (which is externally assessed), and there is no sneaking into a different group to be with your mates (unlike the blue / green waves).
And unlike a Randomised Control Trial, you don’t need to create a control group. No denying some students a bursary so you can compare and contrast. Just look at the line more closely.
So, did the green wave hold me back?
No idea. I don’t have the data!
Next year I’m aiming at sub 2hr, but I’m not going to get there with a quick fix and jumping into a faster wave. But hopefully, I’ll be in that blue wave next year, and see what that’s like…
The point of the article isn’t really about running.
It is illustrative of a way to evaluate, that isn’t used as much as it could be. Applied to large scale interventions in education (or beyond!) things with a cut off (like financial support or qualifying grade boundaries) can be evaluated better. We could see the impact of our work more clearly, and more rigorously using a proper Quasi-Experimental Design (QED).
And now you know what a Regression Discontinuity Design is.
